
Logo
BLOG|
PACA logo

PACA

Scientific Web Application

Sept 2025 - Present

Scientific web application that reconstructs ancient geographic positions of present-day coordinates. It integrates R's palaeoverse package, multiple tectonic reconstruction models, batch CSV processing, and a 3D globe viewer to support paleobiogeography, paleoclimatology, and geological research.

Stack

React
TypeScript
Tailwind
Node.js
R
Docker
GitLab

The Problem

Calculating paleocoordinates is fundamental for paleogeographic and paleoclimatic studies, but current tools often require complex installations, specific programming knowledge (such as R), or obsolete interfaces. This technical difficulty creates a barrier to entry for students and researchers who need to rotate modern geographic coordinates to ancient geological periods efficiently and visually.

The Solution

We designed a platform that simplifies this process through a modern and accessible interface. PACA allows users to calculate paleolatitudes and paleolongitudes directly in the browser, using their current location or through bulk CSV file uploads. By integrating the powerful palaeoverse package into the backend and providing an interactive 3D visualization, the platform democratizes access to advanced tectonic analysis for non-expert users.

Architecture

Frontend
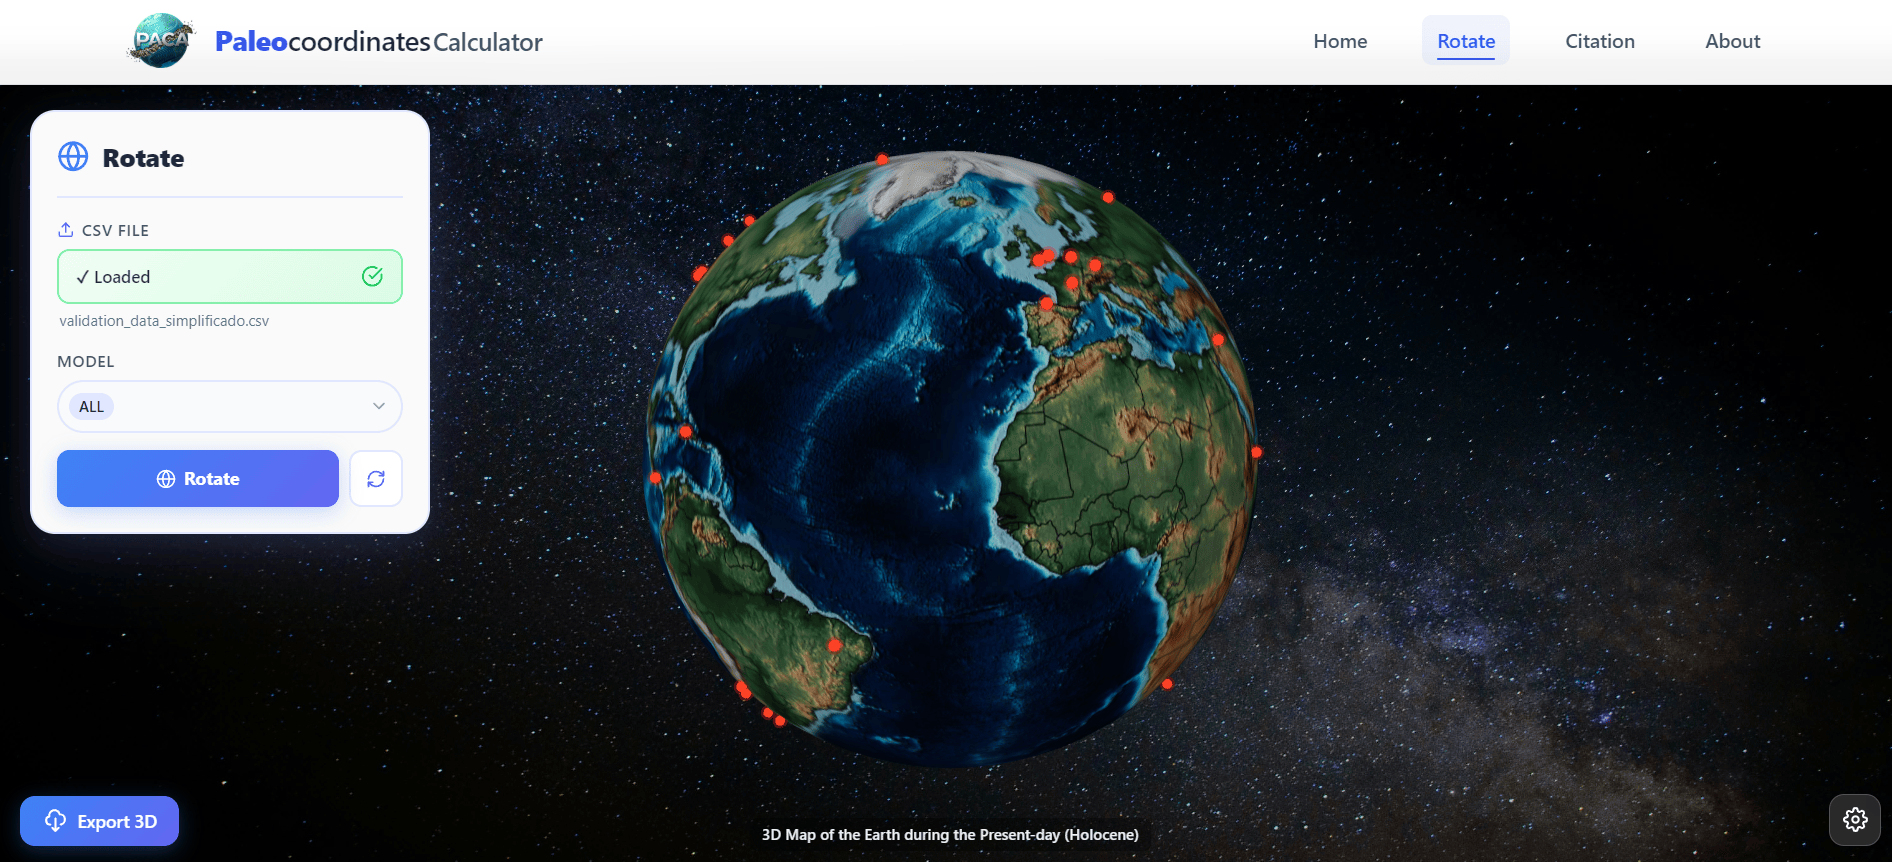
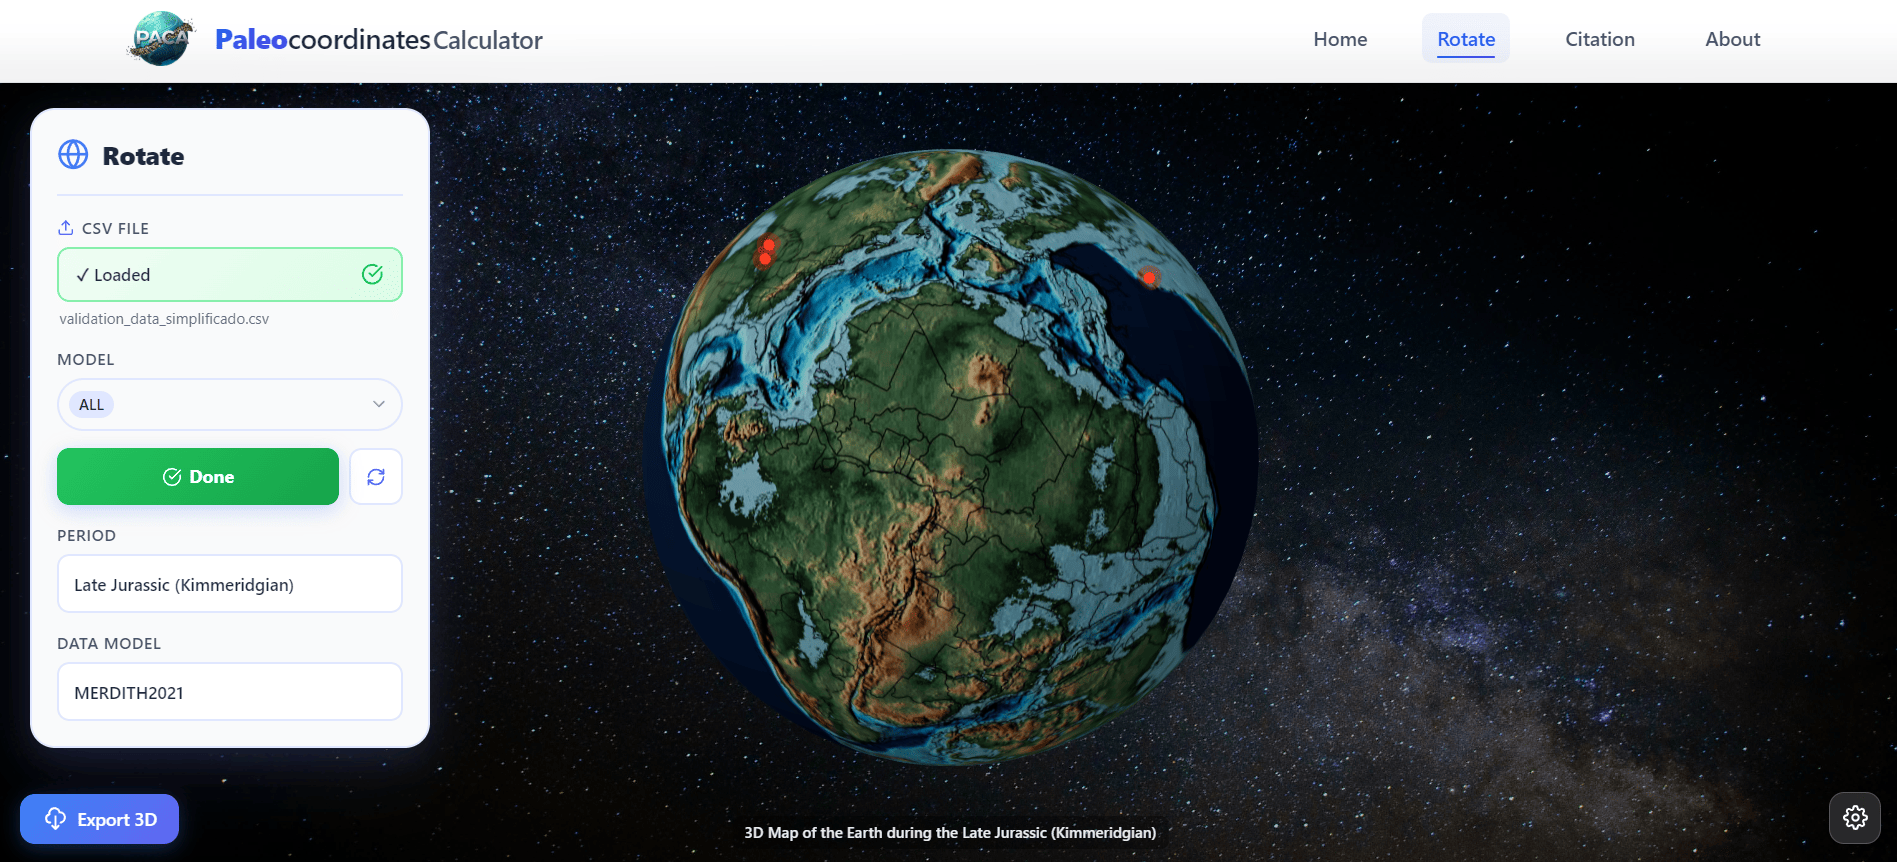
The frontend is built with React, Vite, and TypeScript, offering a fast and fluid user experience. The centerpiece is an interactive 3D globe developed with react-globe.gl and Three.js (@react-three/fiber), which allows for intuitive visualization of rotation results. It supports orbit controls, zoom, and exporting scenes in GLB format. The design is responsive and modern, implemented entirely with Tailwind CSS.
Backend
The backend, developed with Node.js and Express, acts as the system's processing core. It handles data reception and file uploads via multer, coordinating the execution of R scripts on the server. It uses the palaeoverse library to perform precise tectonic rotations based on recognized global models such as MERDITH2021, PALEOMAP, and Torsvik-Cocks 2017. Results are processed and served in real-time for visualization or download.
Data Flow
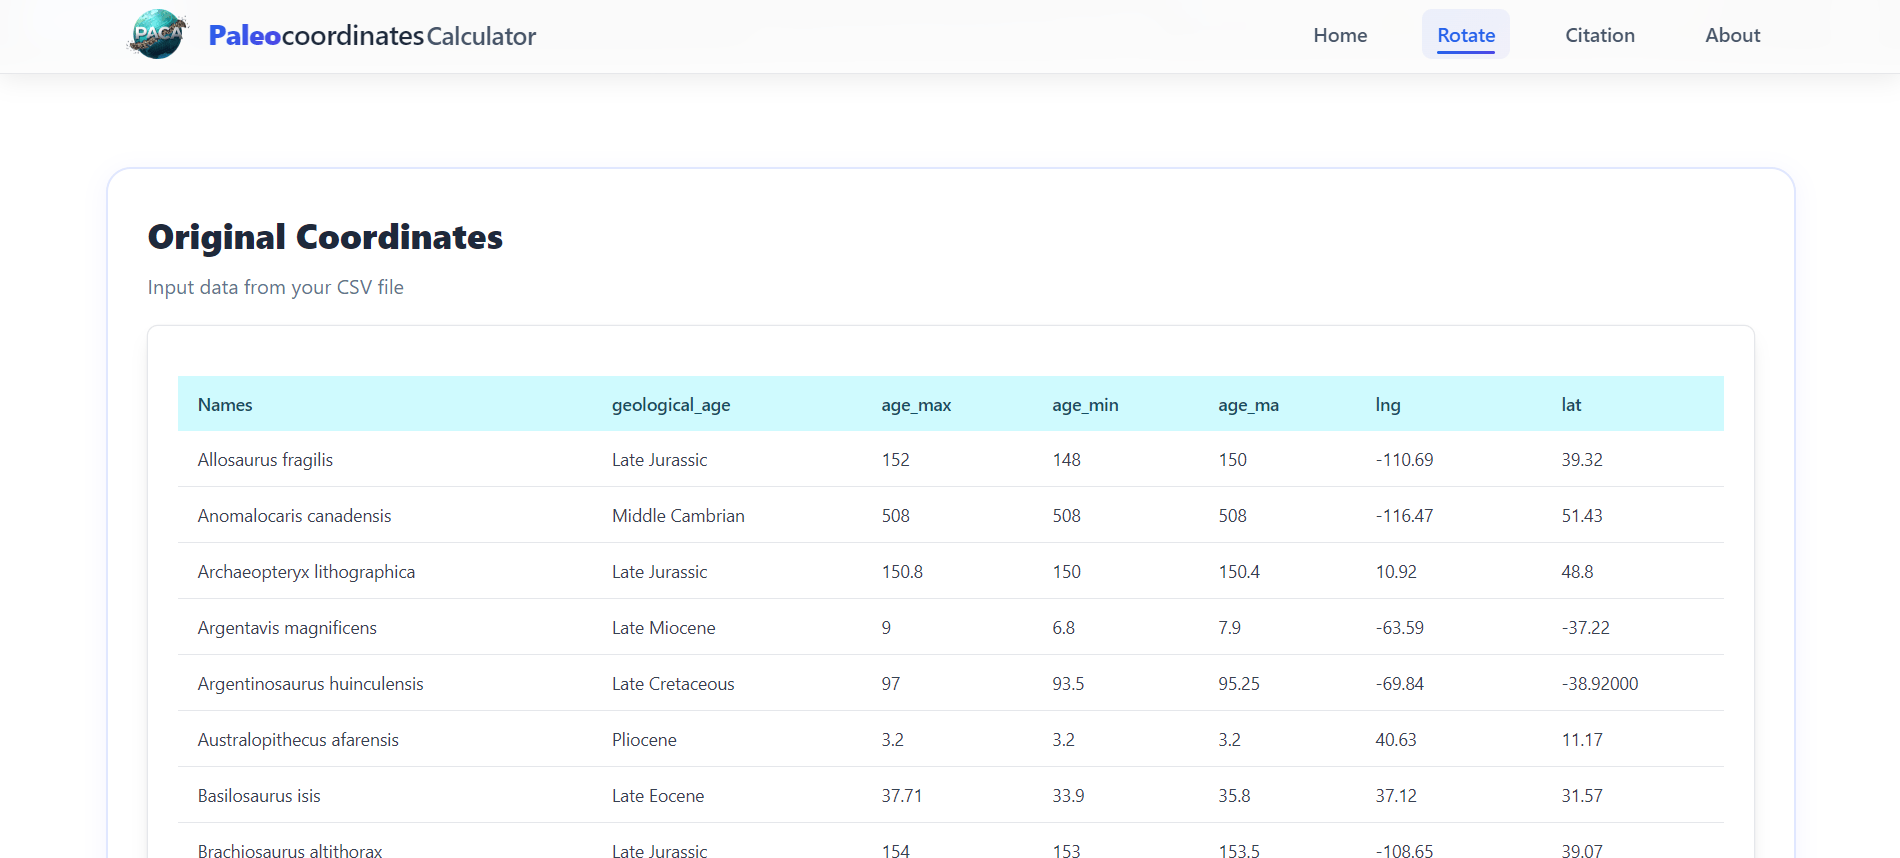
The flow begins when the user manually enters coordinates or uploads a CSV file. The backend receives this data and triggers an R process that applies tectonic rotations according to the selected model. Once the computation is complete, the results are temporarily stored and sent back to the frontend. Finally, the user can explore the rotated points on the 3D globe and download a detailed CSV report with the new coordinates.
BaseStep 1Step 2Step 3
1-Load CSV
Deployment & CI/CD
The deployment is fully containerized using Docker and orchestrated with Docker Compose, separating frontend and backend responsibilities into independent services. The CI/CD pipeline in GitLab automates image builds (using Docker-in-Docker), registers them in the GitLab Registry, and facilitates continuous deployment to VPS servers, ensuring stable integration and automatic system updates.

Screenshots

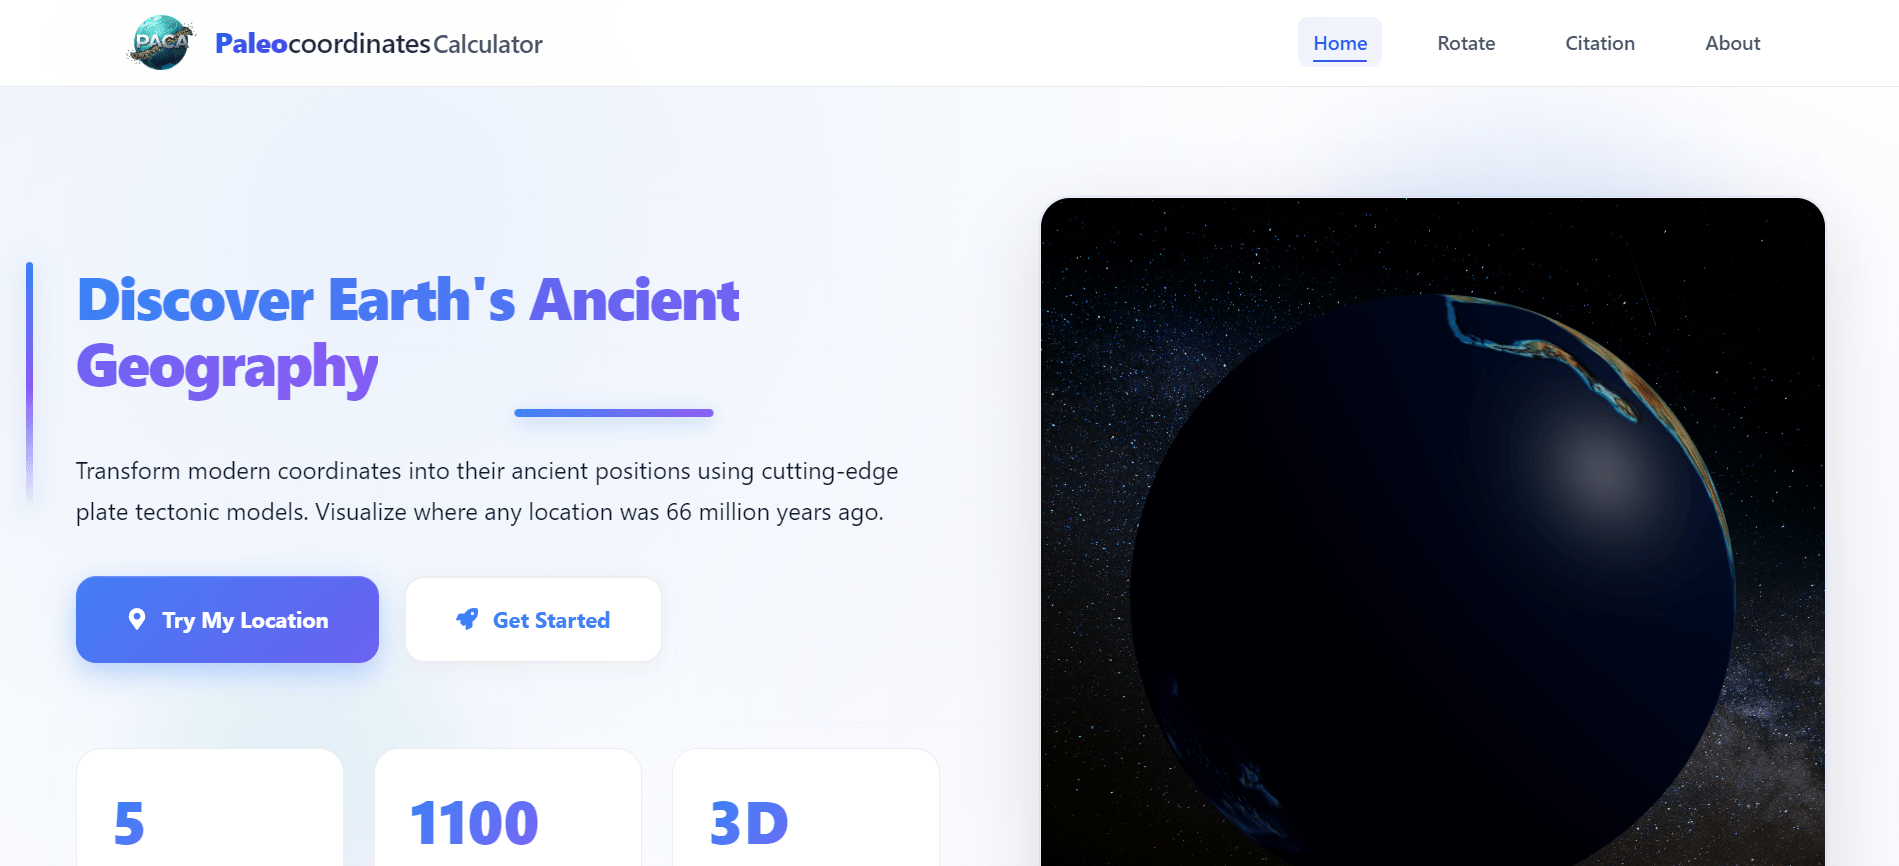
Homepage

Homepage

Main interface for paleocoordinate calculations with interactive map.
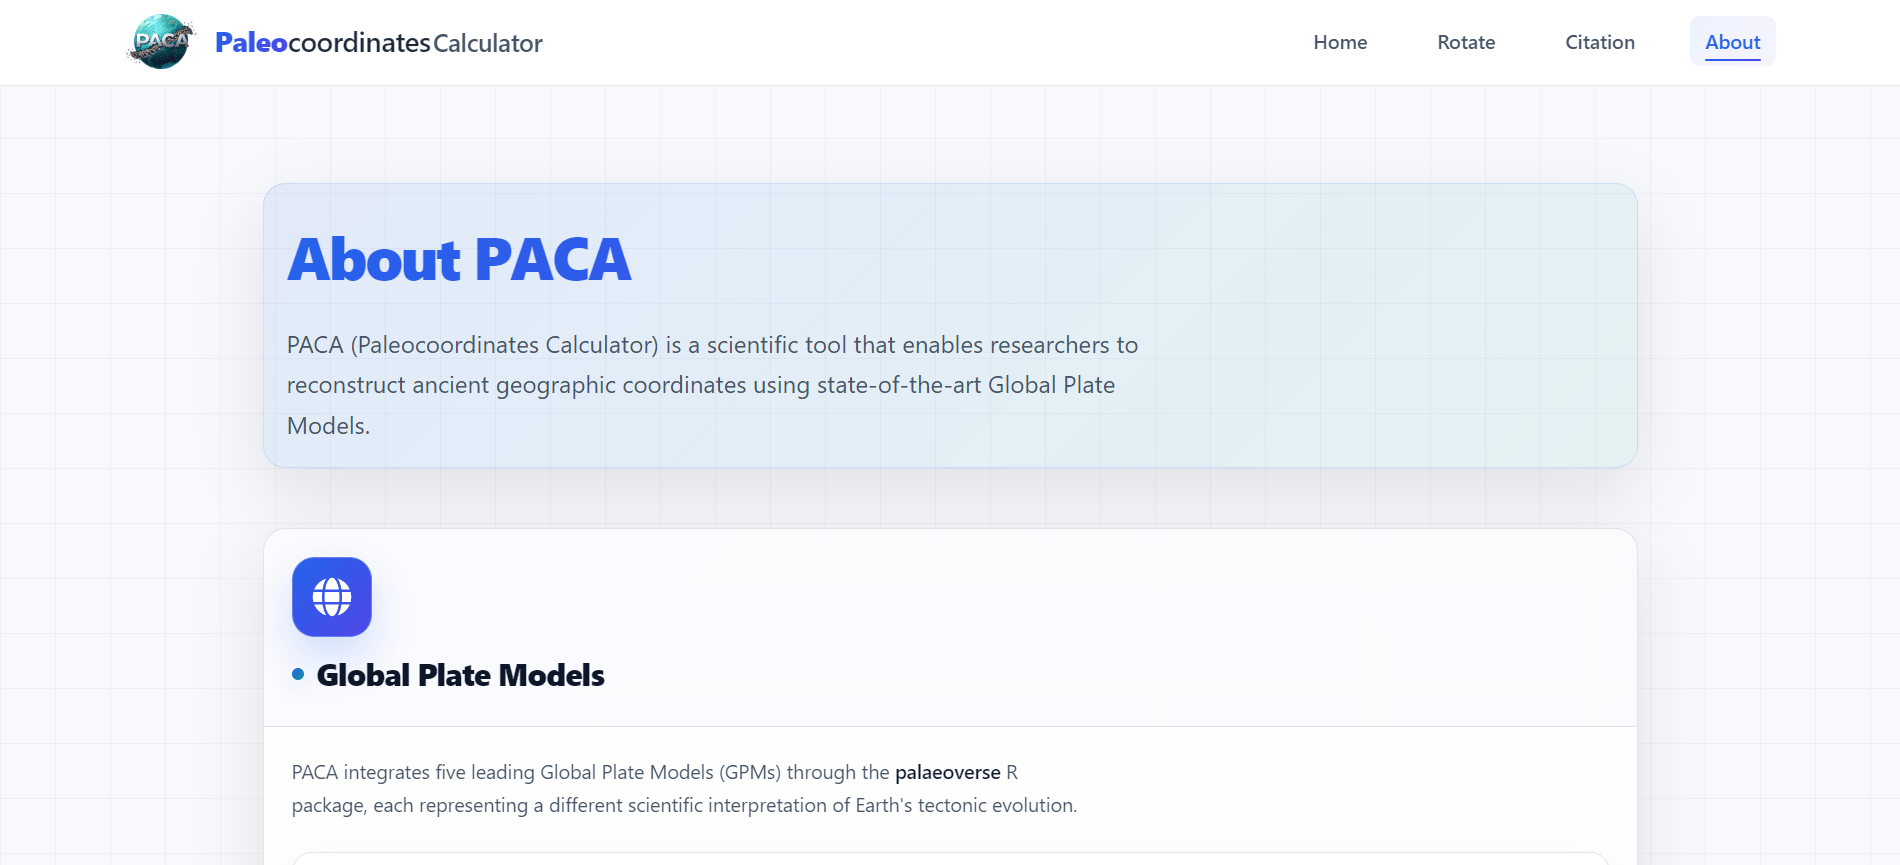
About

About

Information about the project and methodology.
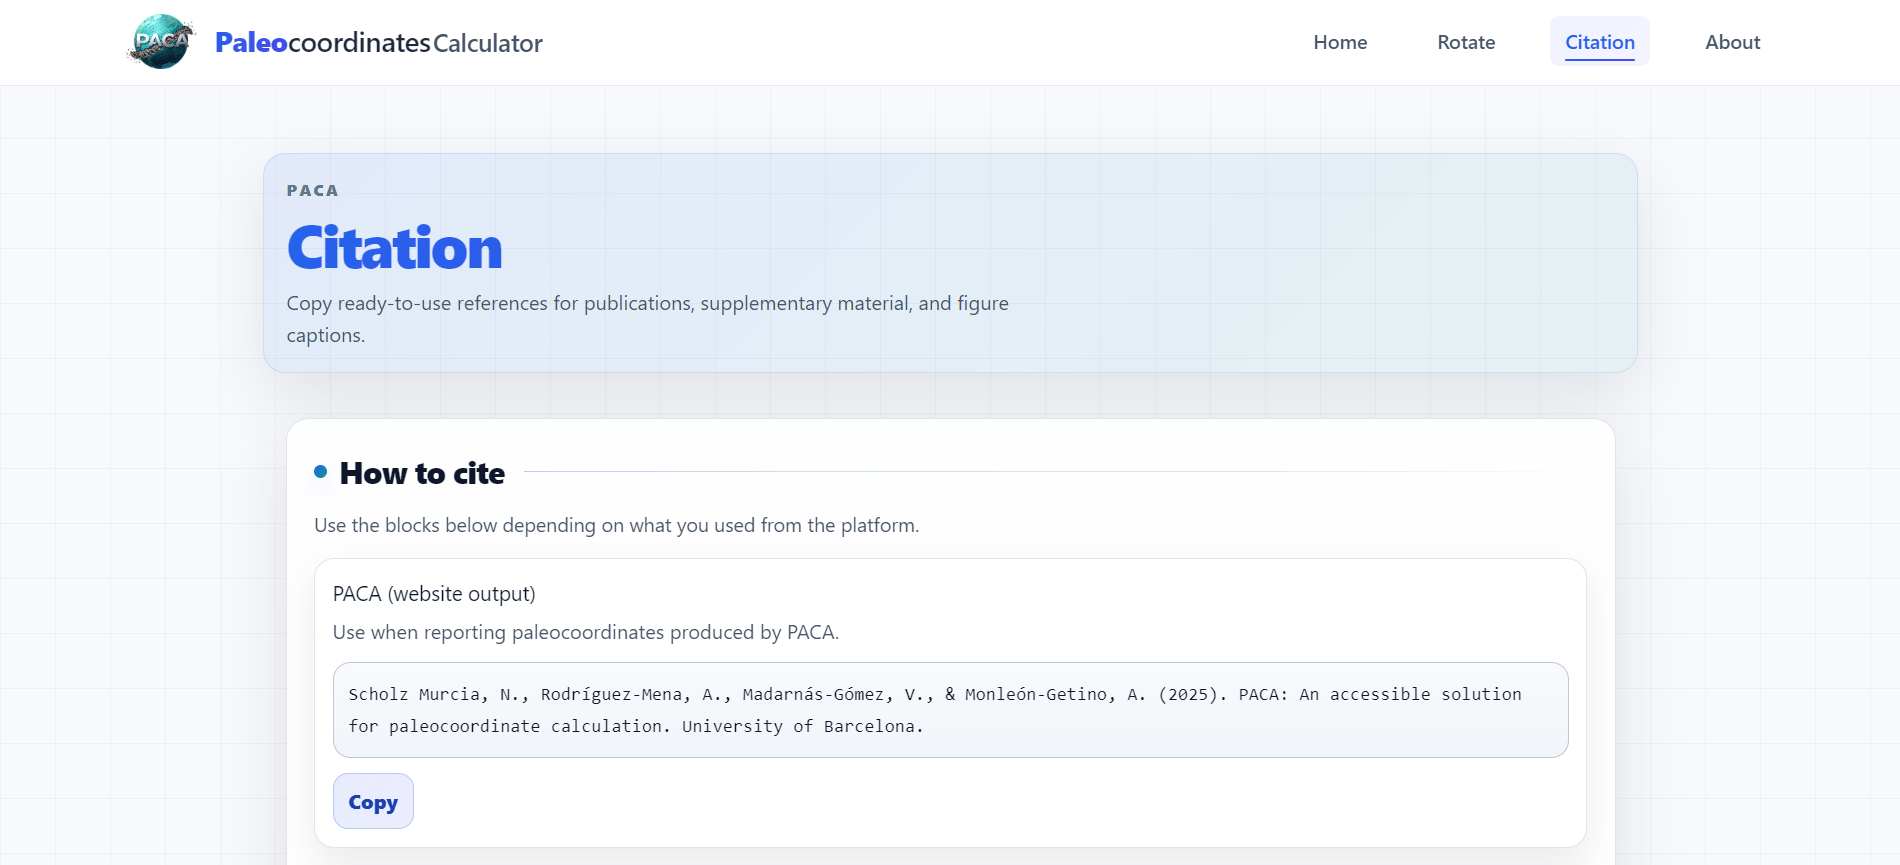
Citation

Citation

Citation generator for academic references.
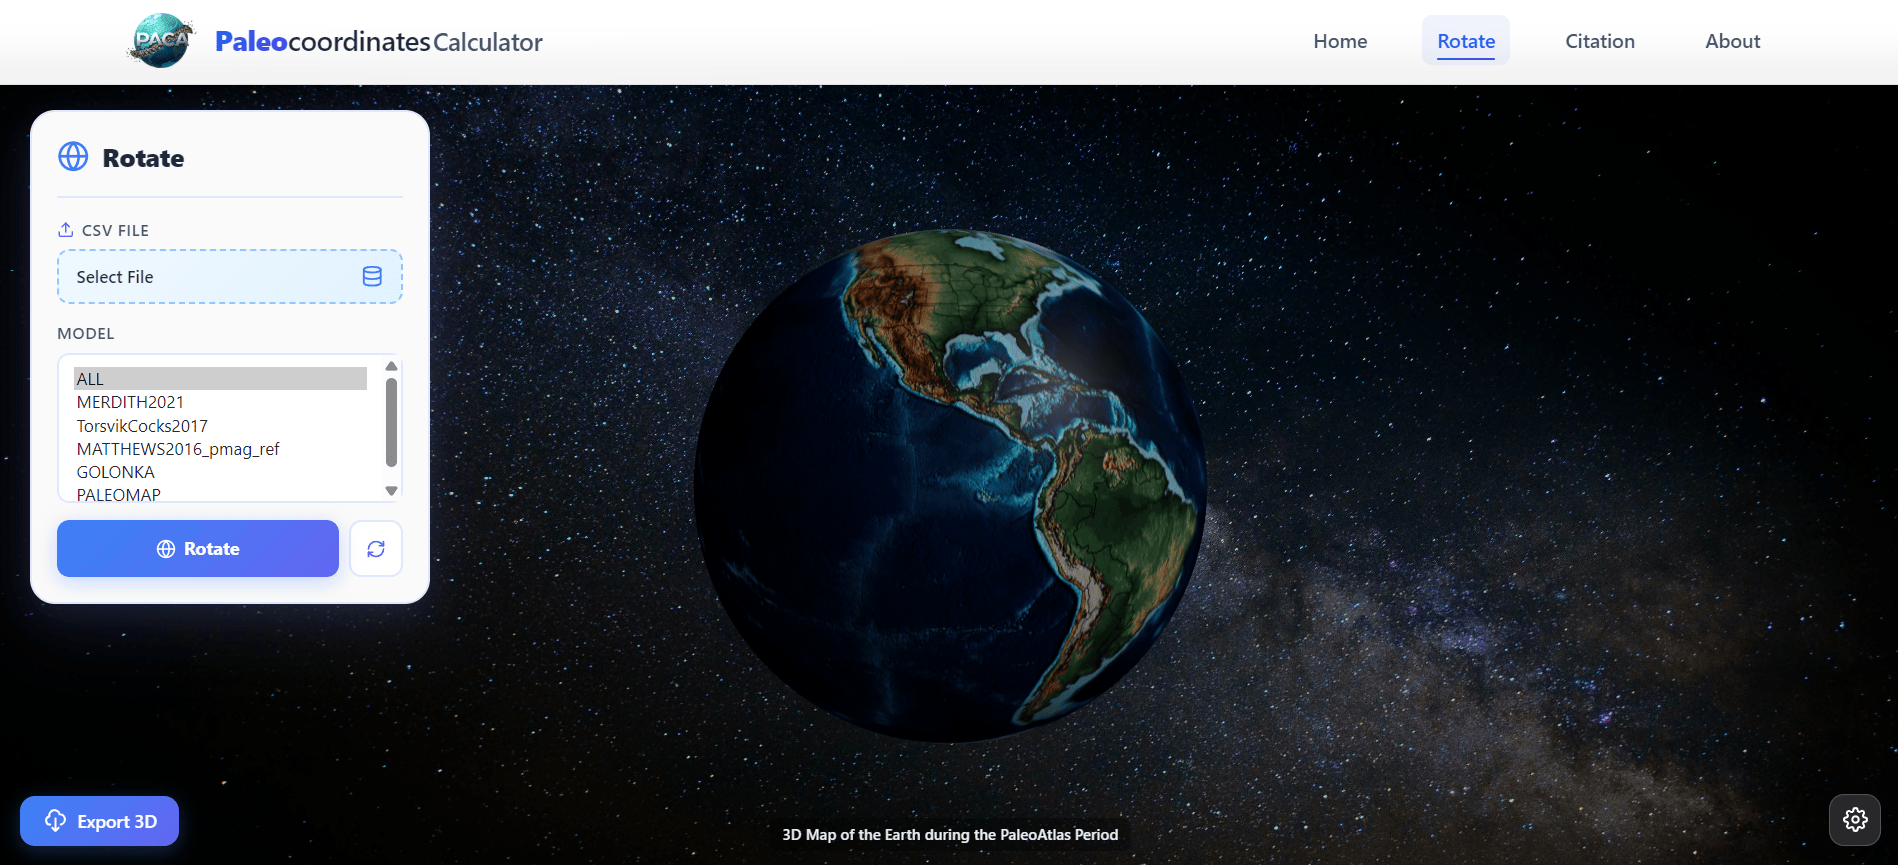
3D Globe

3D Globe

Interactive 3D globe viewer for tectonic plate visualization.

Funded by
Universitat de Barcelona